ReFed Food Waste Data

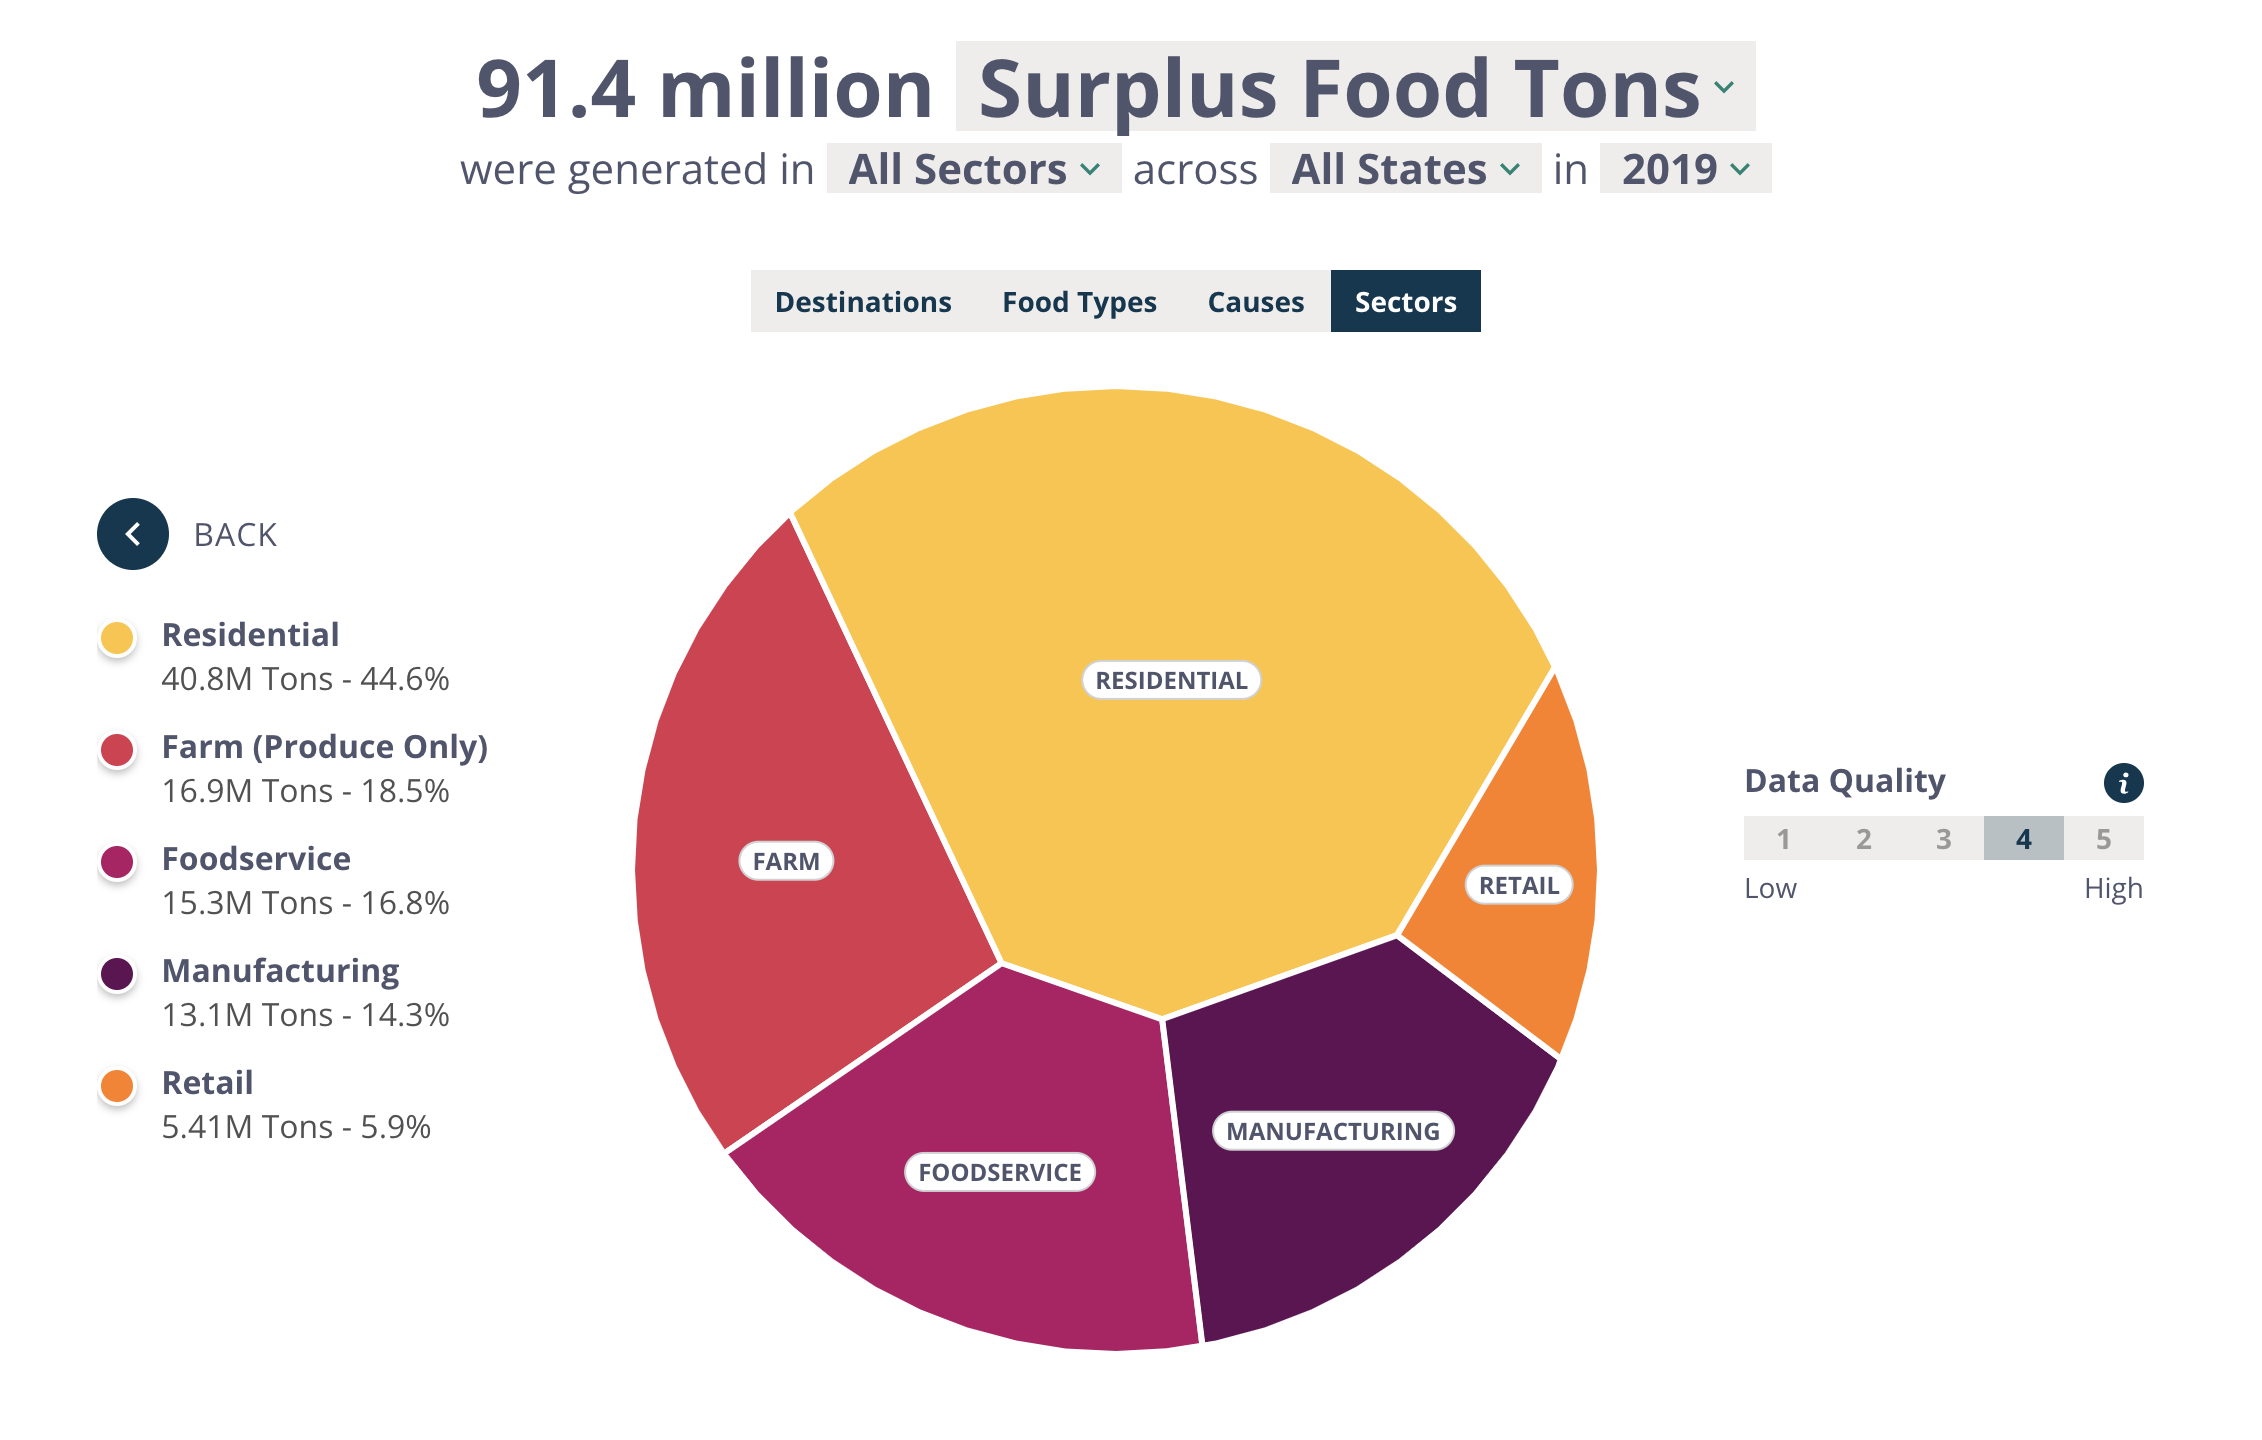
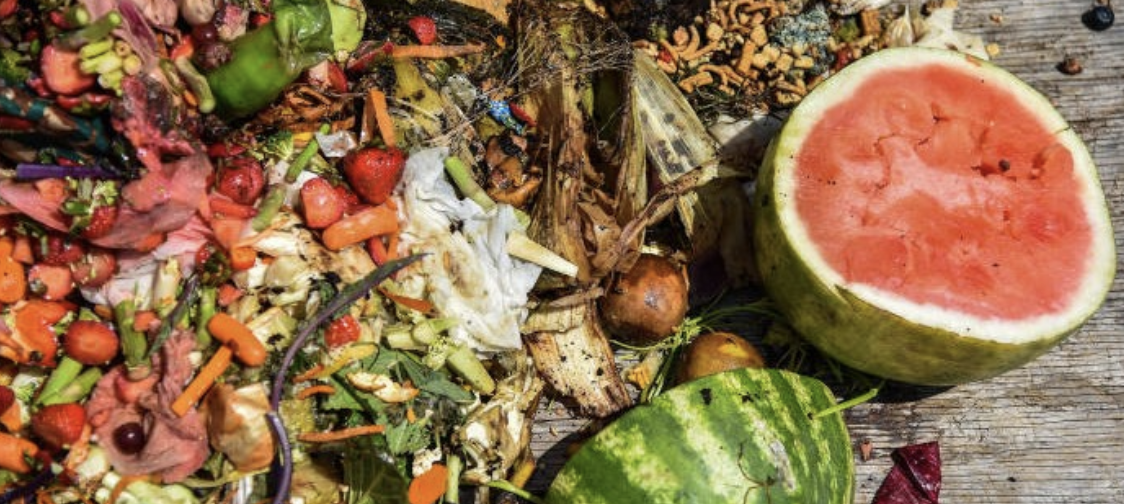
Find out how much food is going uneaten in the US, learn why it’s happening, and see where it goes. WHAT IS THIS TOOL? A centralized repository of information built with data from more than 50 public and proprietary datasets and providing granular estimates of how much food goes uneaten in the U.S., why it’s […]

Water Footprint Calculator

This free tool, available in both English and Spanish, illustrates how everyday actions – from washing dishes to watering the lawn to buying groceries – impact water use. The tool links to over 100 water saving tips, and the site has grown to include middle- and high-school lesson plans as well as reference material about […]

Foodmiles

Food miles are a way of attempting to measure how far food has travelled before it reaches the consumer. It is a good way of looking at the environmental impact of foods and their ingredients. It includes getting foods to you, but also getting waste foods away from you, and to the landfill (Source). Resource […]

Find Your Foodprint

Food impacts more than your health. It impacts the environment, animals and people. What you eat, where it comes from, and how it was produced contributes to your FoodPrint — think of it like a carbon footprint, but for food. So what’s your FoodPrint? Take this 3-minute quiz to find out (Source). Resource Creator(s) Foodprint […]

Food Carbon Emissions Calculator

Using the Food Carbon Emissions Calculator, you can calculate the carbon emissions from your food reported above in Kg of CO2e, including major greenhouse gases such as carbon dioxide, methane and nitrous oxide. The calculator breaks down the following: *Production emissions for the production (cradle to farmgate) and any processing of quantity purchased *Transport emissions […]

Climate change food calculator: What’s your diets carbon footprint?

Using the Climate change food calculator, users learn more about the impact meat and dairy products have on their environmental footprint. But what is the difference between beef and chicken? Does a bowl of rice produce more climate warming greenhouse gases than a plate of chips? Is wine more environmentally friendly than beer? To find […]

Global Carbon Atlas

The Global Carbon Atlas is a platform to explore and visualize the most up-to-date data on carbon fluxes resulting from human activities and natural processes. Users can explore and download global and country level CO₂ emissions from human activity and look at the latest global updates that affect carbon emissions such as the Global Greenhouse […]

The Carbon Map

The Carbon Map provides current and historical carbon emission, extraction, consumption, and reserve data. The traditional Robinson map is used to start but can be shifted to show actual land area, population, wealth, people at risk, sea level, and poverty – helping students visualize and make connections between carbon emissions and the above listed factors. […]

World Air Map

This map shows population size, city pollution, background pollution, and plume AQI index in cities in every part of the world. Resource Creator(s) PlumeLabs’ mission is to make air quality information accessible and empowering. Every year, across every border on this planet, air pollution causes more than 7 million premature deaths. The magnitude of the […]

Illinois Public Health Community Map

This resource is an interactive map provided by the Illinois Public Health Department. Using the map, you can look at doctor visit rates for the health issues listed below. The map provides data on race/ethnicity, age, education, and household income in various community areas across the state of Illinois. The map provides data for the […]