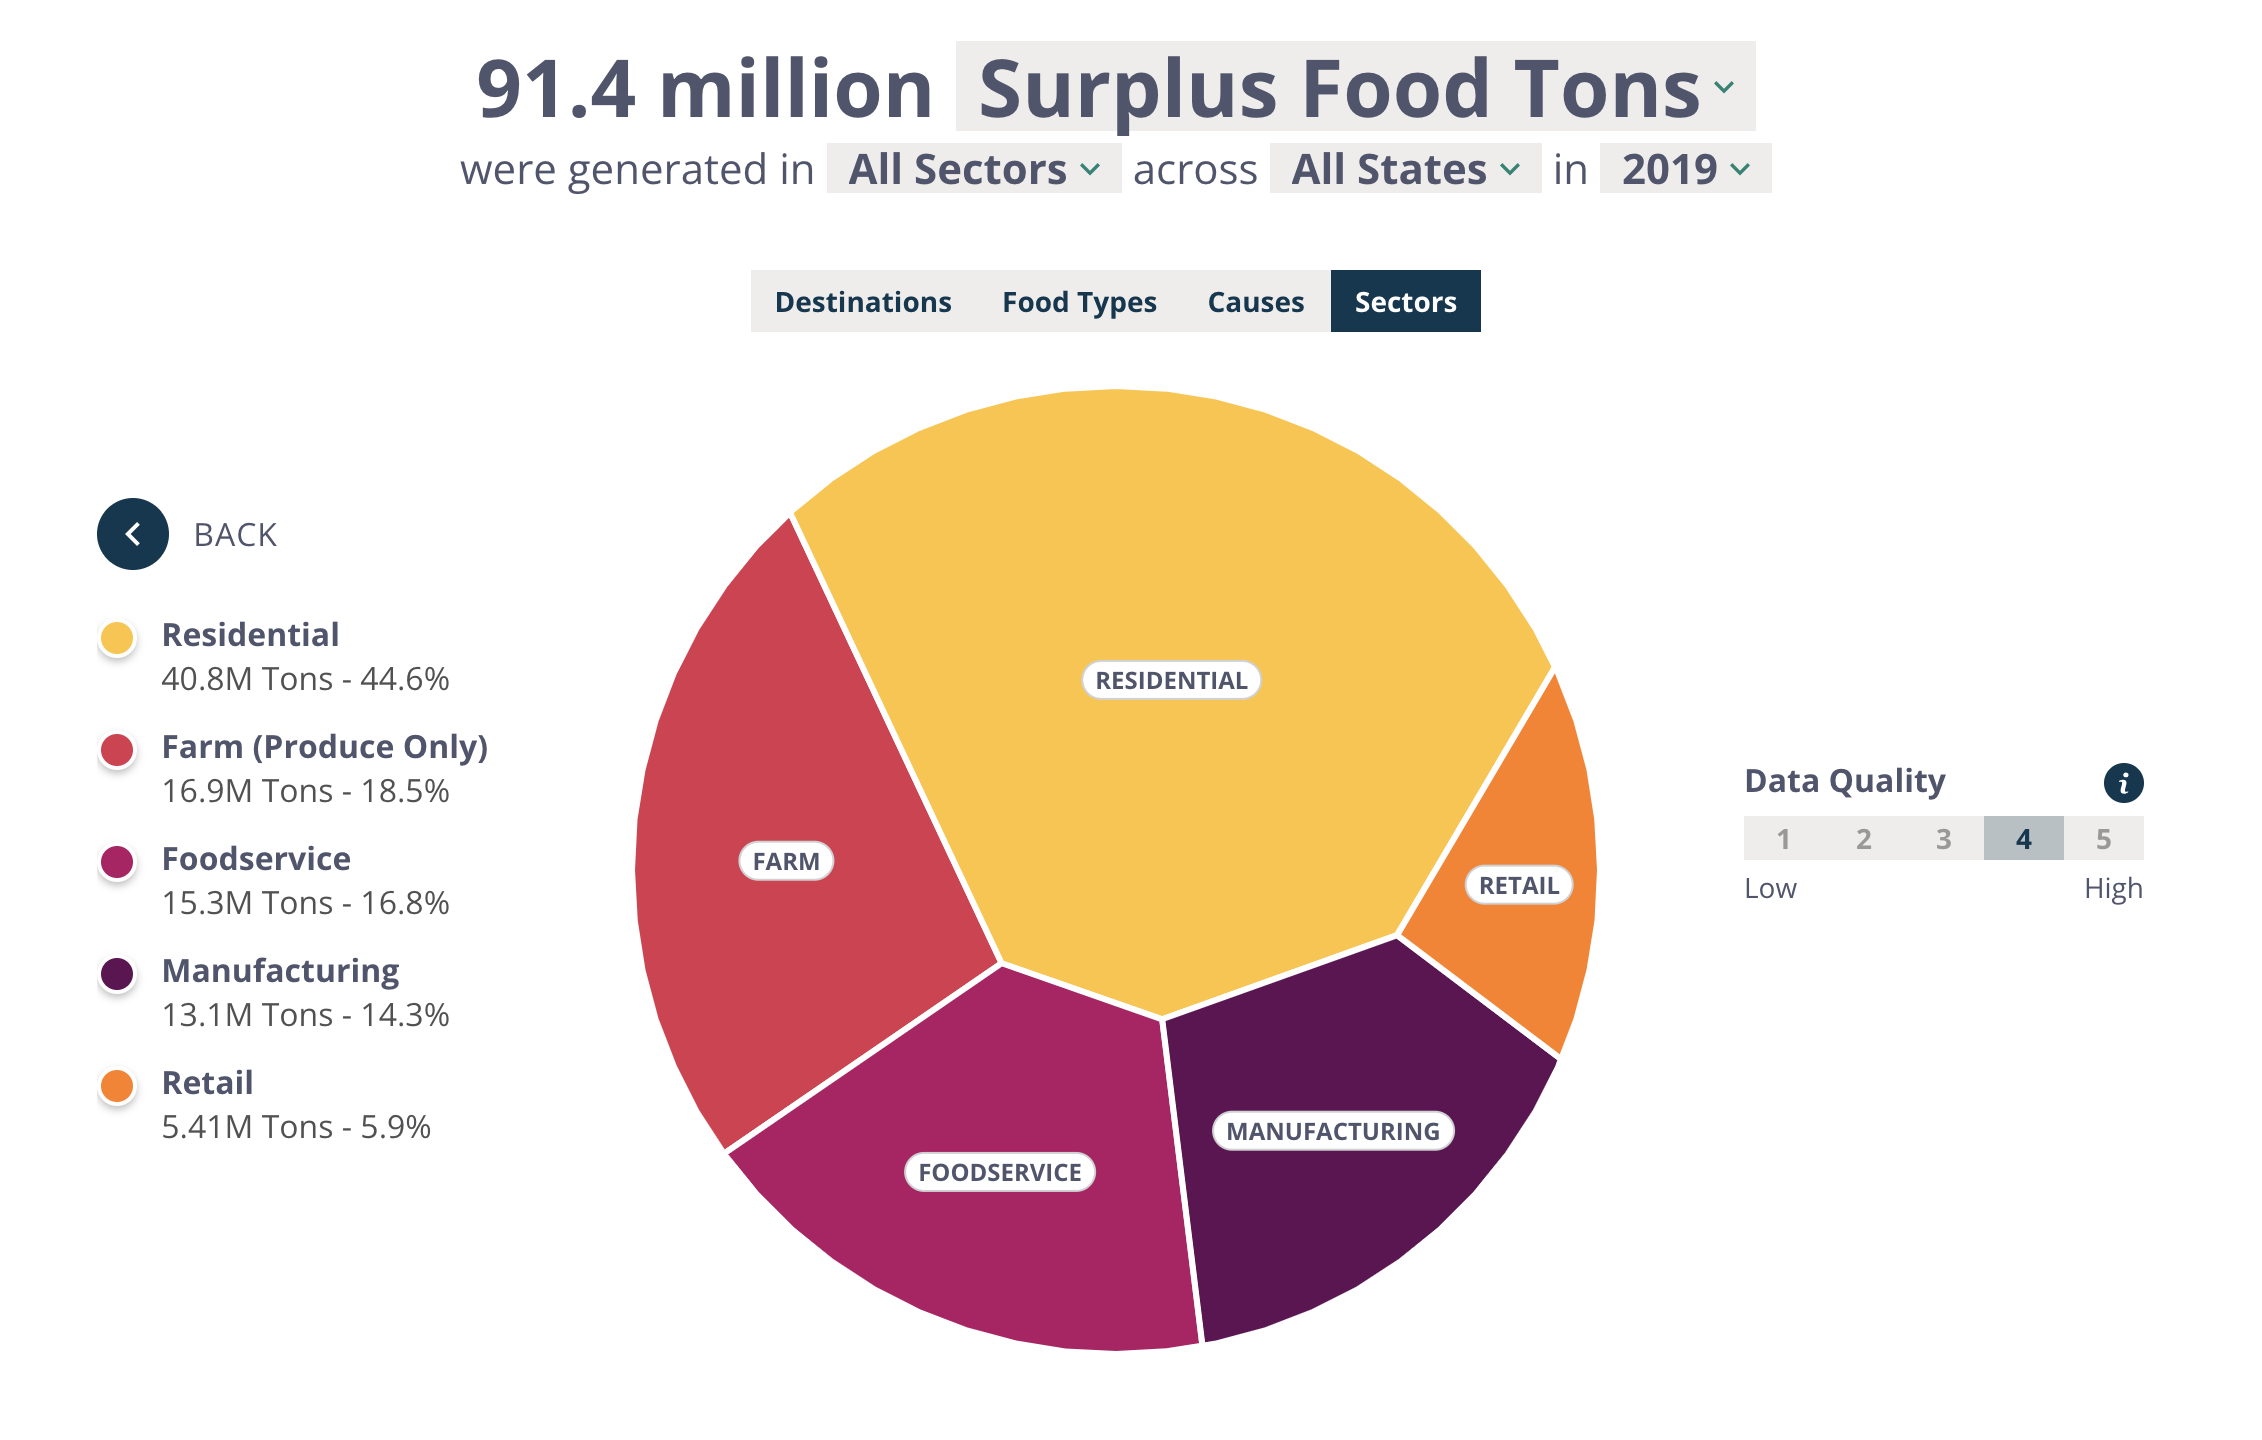
ReFed Food Waste Data

Find out how much food is going uneaten in the US, learn why it’s happening, and see where it goes. WHAT IS THIS TOOL? A centralized repository of information built with data from more than 50 public and proprietary datasets and providing granular estimates of how much food goes uneaten in the U.S., why it’s […]
Environmental Impacts of Food Production

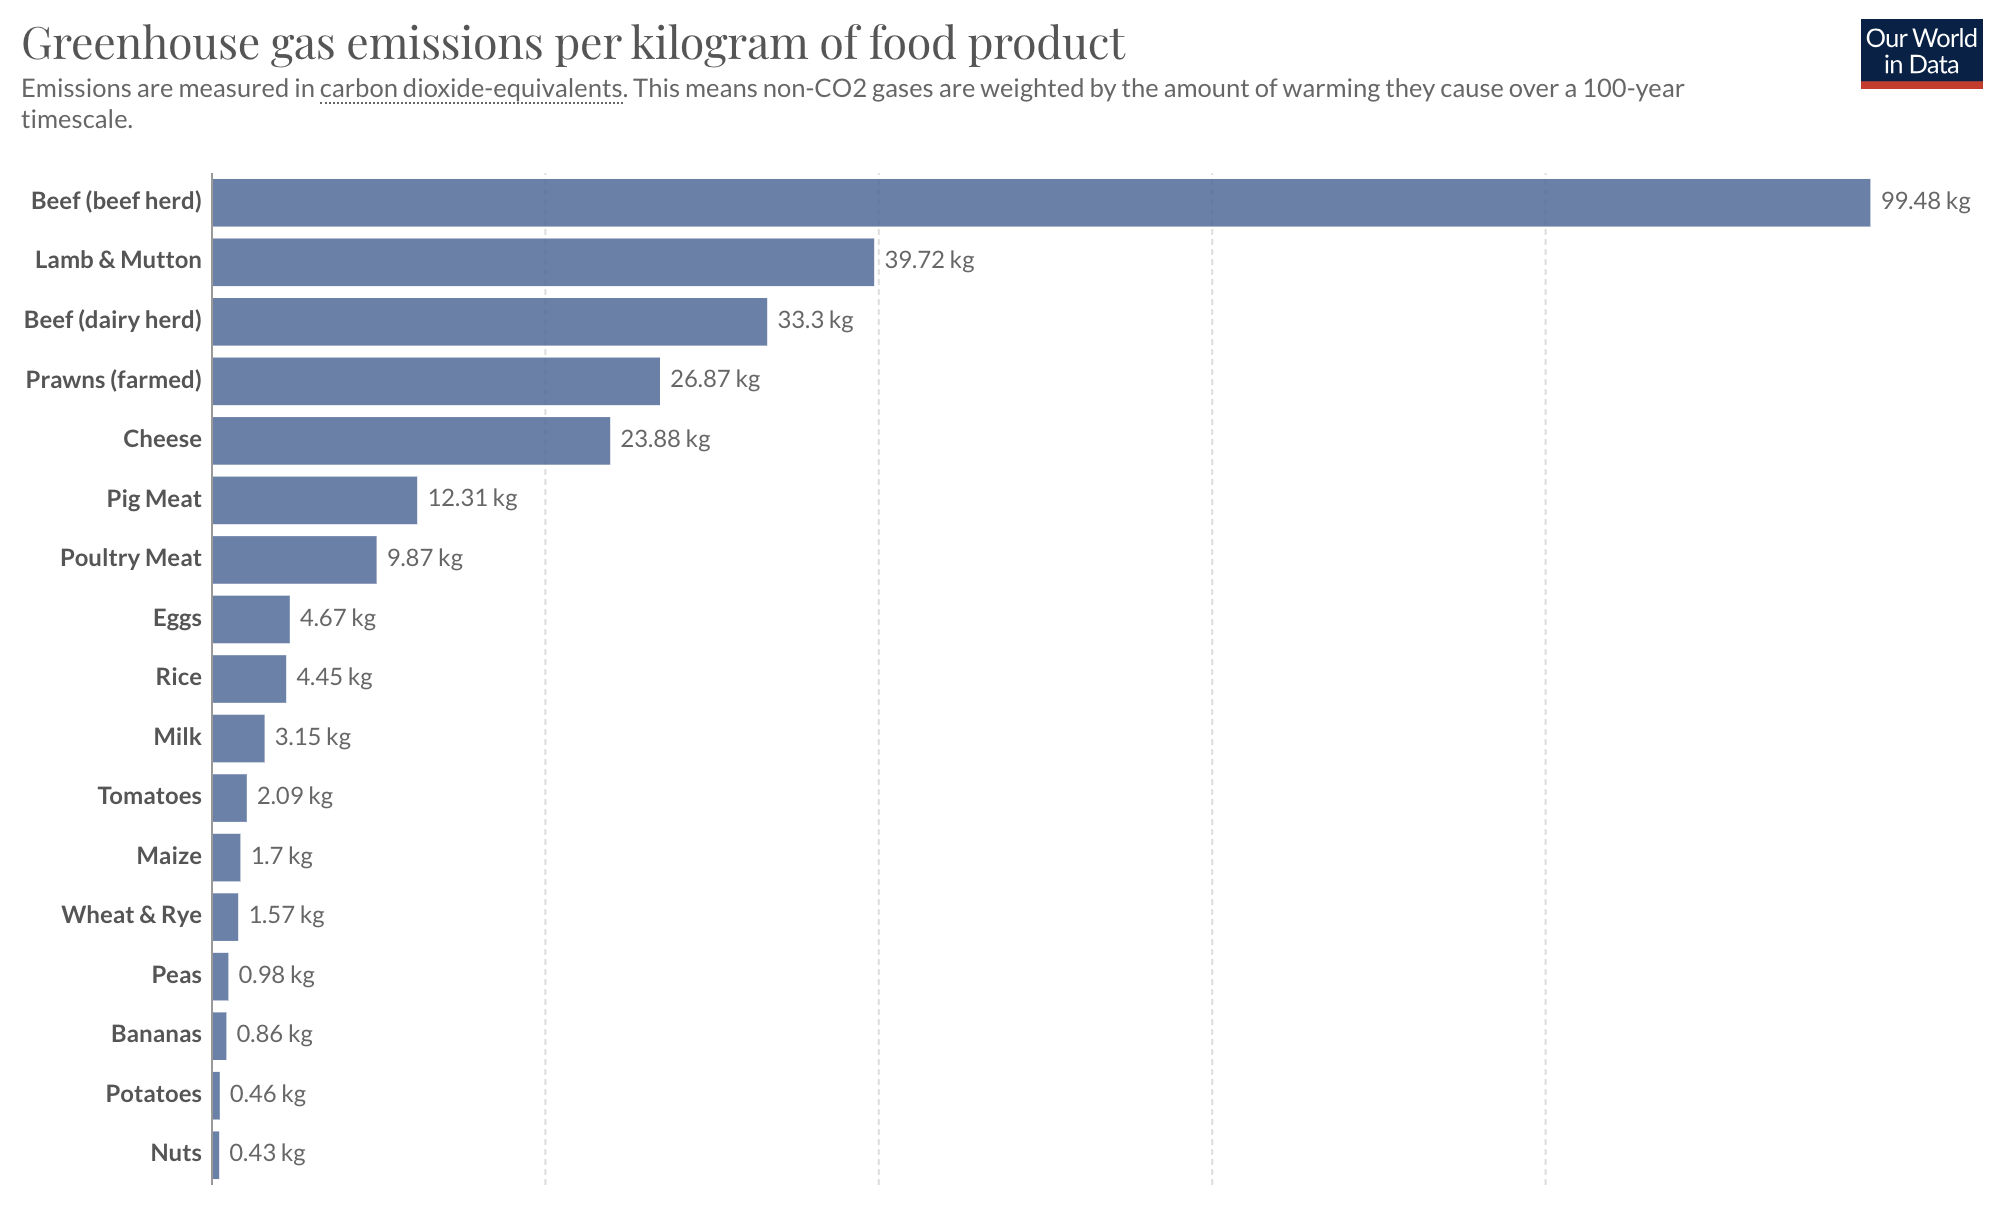
Agriculture has a significant environmental impact in three key ways. First, it requires large amounts of fresh water, which can cause significant environmental pressures in regions with water stress. It needs water as input and pollutes rivers, lakes, and oceans by releasing nutrients. It is a crucial driver of climate change, responsible for around one-quarter of the […]

Water Footprint Calculator

This free tool, available in both English and Spanish, illustrates how everyday actions – from washing dishes to watering the lawn to buying groceries – impact water use. The tool links to over 100 water saving tips, and the site has grown to include middle- and high-school lesson plans as well as reference material about […]

Global Carbon Atlas

The Global Carbon Atlas is a platform to explore and visualize the most up-to-date data on carbon fluxes resulting from human activities and natural processes. Users can explore and download global and country level CO₂ emissions from human activity and look at the latest global updates that affect carbon emissions such as the Global Greenhouse […]

The Carbon Map

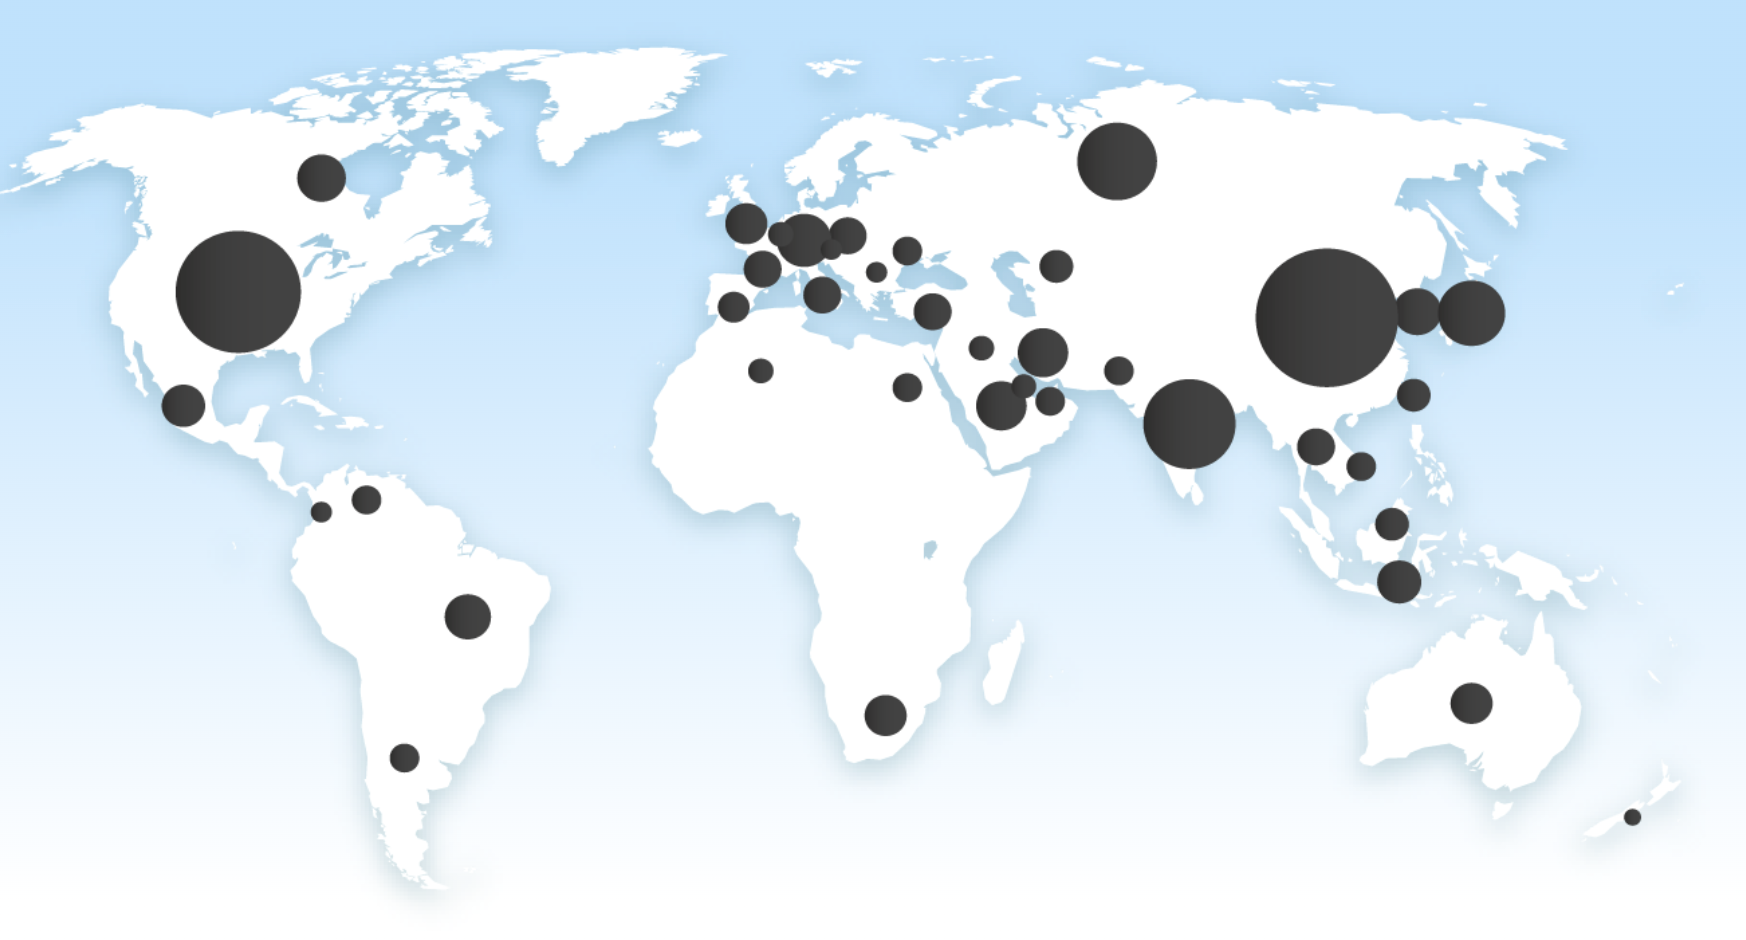
The Carbon Map provides current and historical carbon emission, extraction, consumption, and reserve data. The traditional Robinson map is used to start but can be shifted to show actual land area, population, wealth, people at risk, sea level, and poverty – helping students visualize and make connections between carbon emissions and the above listed factors. […]

The Weight of Numbers: Air Pollution and PM2.5

Emanating from smokestacks, vehicle engines, construction projects, and fires large and small, airborne pollution – sometimes smaller than the width of a human hair, and very often the product of human activity – is not just contributing to climate change. It is a leading driver of heart disease and stroke, lung cancer, and respiratory infections the […]

Chicago Flood Equity Map

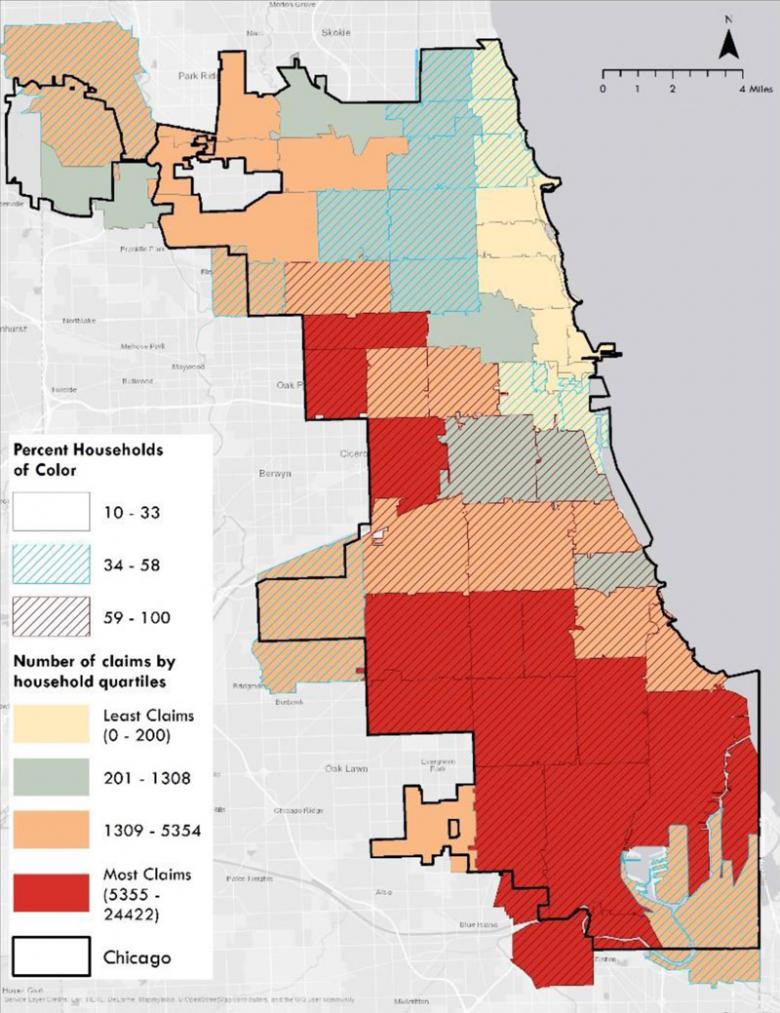
This interactive map shows the racial disparities in flooding by Chicago zip code. Click a location on the map to view underlying flood statistics within that zip code. You may also search for an address or zip code to locate a specific place of interest (Source). Creator(s): Center for Neighborhood Technology CNT delivers innovative analysis […]

More Than 90% of the World’s Children Breathe Toxic Air Every Day

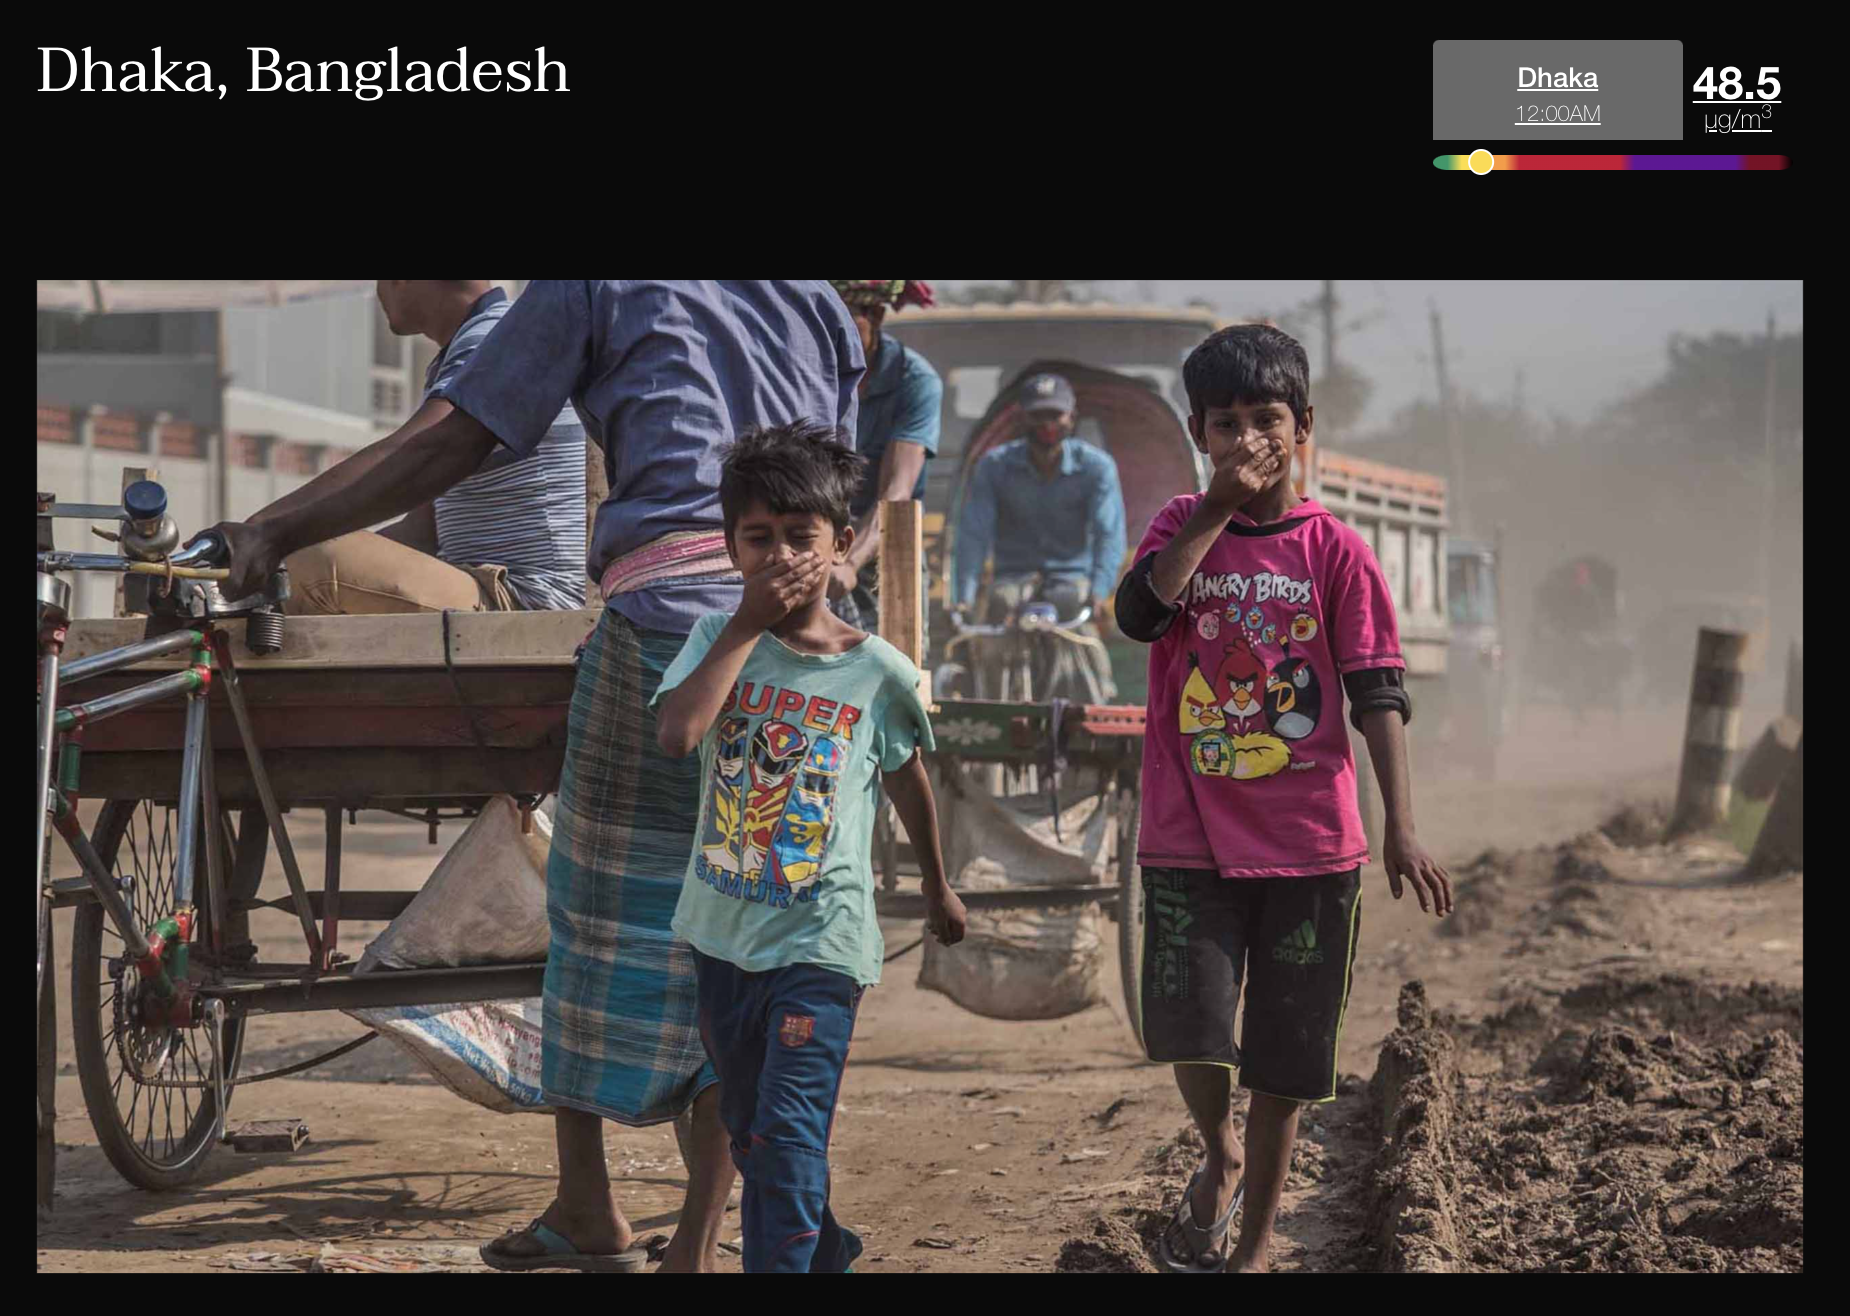
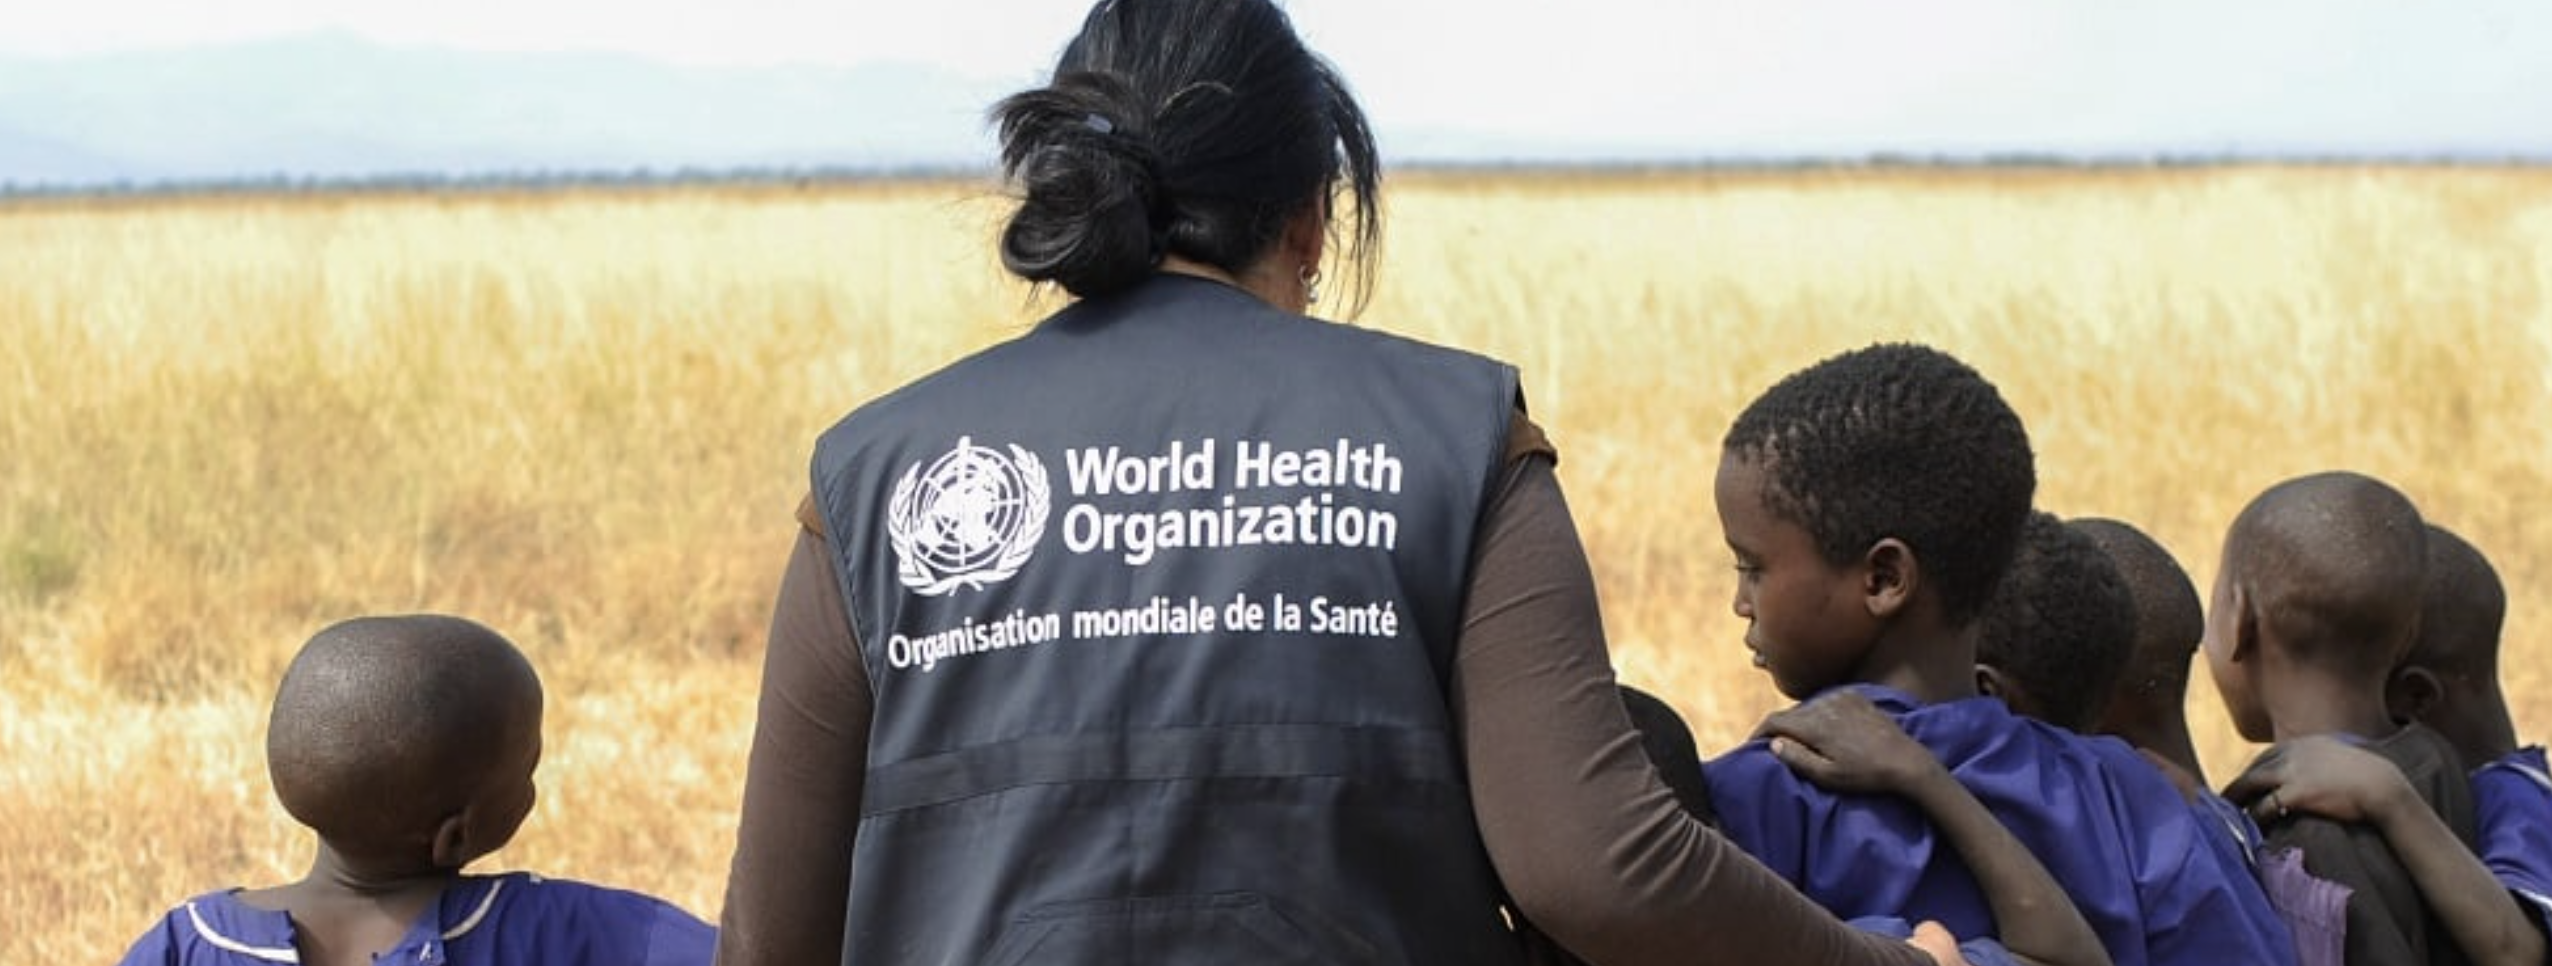
Every day around 93% of the world’s children under the age of 15 years (1.8 billion children) breathe air that is so polluted it puts their health and development at serious risk. Tragically, many of them die: WHO estimates that in 2016, 600,000 children died from acute lower respiratory infections caused by polluted air (Source). […]

Climate and Clean Air Coalition

The Climate and Clean Air Coalition has an action resource library with articles and datasets concerning air pollution in various countries along with the policies that are in place to address the situation. Organization: Climate and Clean Air Coalition The Union is the international federation of civil society organisations concerned with air pollution. Most of […]