IQAir Earth

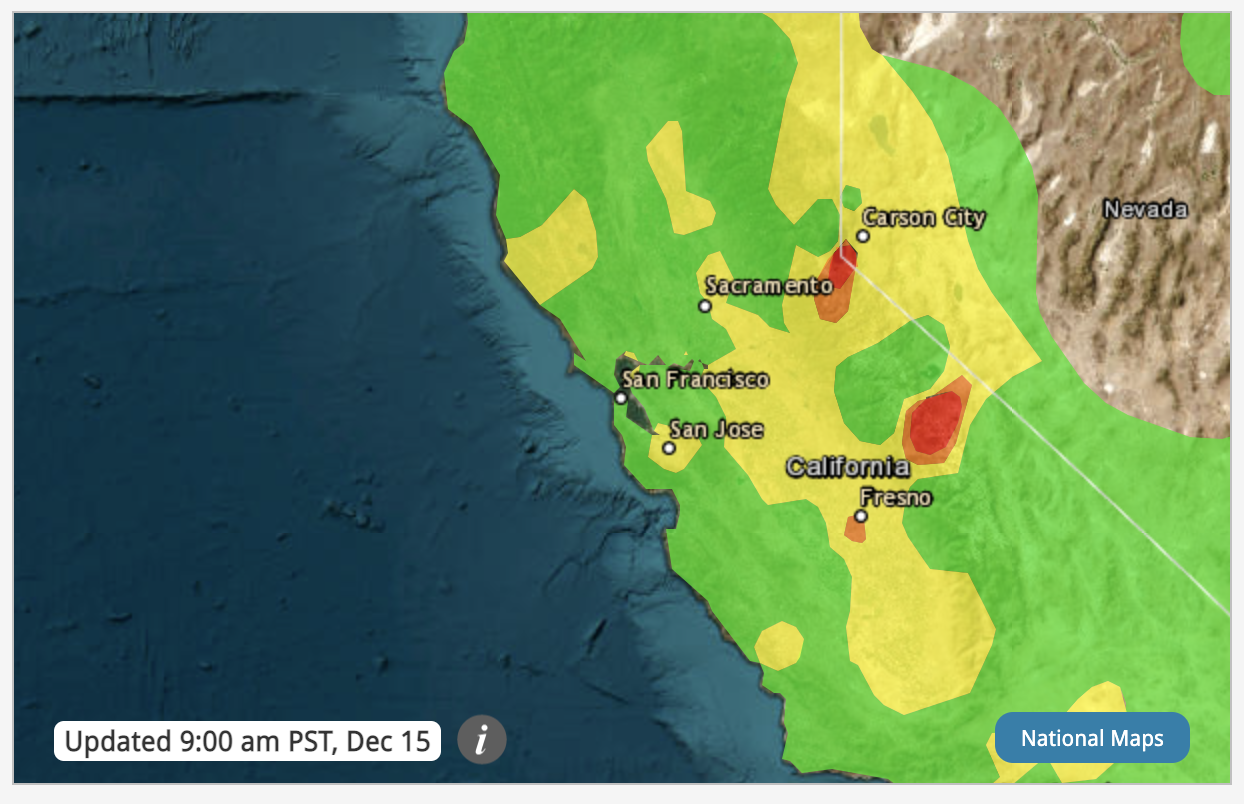
This resource is an interactive map that shows the Air Quality Index in cities all over the world. It also provides a daily world AQI ranking. Organization: IQAir Every year, 7 million people die from air pollution, and billions suffer unnecessarily from the effects of poor air quality. Yet many of people don’t have access to […]

Chicago Flood Equity Map

This interactive map shows the racial disparities in flooding by Chicago zip code. Click a location on the map to view underlying flood statistics within that zip code. You may also search for an address or zip code to locate a specific place of interest (Source). Creator(s): Center for Neighborhood Technology CNT delivers innovative analysis […]

Think Earth Environmental Education Foundation

The Think Earth Environmental Education Foundation provides virtual field trips so students can explore the ocean in their own classroom. Each virtual field trip contains the following: They also provide free K-8 curriculum for those who make a free account. Think Earth instructional units teach students: Think Earth helps develop students’ understanding of how their […]

AirNow

AirNow is your one-stop source for air quality data. Their recently redesigned site highlights air quality in your local area first, while still providing air quality information at state, national, and world views. A new interactive map even lets you zoom out to get the big picture or drill down to see data for a […]

Environmental Comics Database

The Environmental Comics Database was created by Brianna Anderson, a PhD candidate in English at the University of Florida, as the first chapter of her dissertation, Greening the Gutters: Visualizing Environmental Disaster and Youth Eco-Activism in Children’s Comics. The project argues that argues that the unique multimodal properties of comics, graphic novels, and zines enable […]

Kiasma Online Art

Kiasma Online Art takes the art beyond the walls of the museum, making the online collection accessible to anyone, anytime and anywhere. It marks a paradigm shift in the way that art is created, presented and experienced. Students are able to look and read about different art pieces and have the opportunity to make their […]

#MoveTheDate Solutions

This resource allows students, families, and teachers to look at sustainable solutions proposed by others around the globe. Students can even submit solutions they develop themselves. Solutions can link to how we help nature thrive, design cities, power ourselves, feed ourselves, and how many of us there are on the planet.

Interactive Global Footprint Data

This resource provides students with data on the global footprint of each country across the globe. The data is updated every year. Some of the data provided includes a country’s ecological footprint per person, total biocapacity, ecological deficit and reserve. Ecological Footprint Initiative at York University are scholars, students, researchers, and collaborating organizations working together […]

Ecological Footprint Calculator

Students can use their data to discover how many Earths we would need if everyone led a lifestyle similar to theirs. They can also look at a map to see where most of their resources come from along with data on consumption, land type for the resources used, and possible solutions. All of this information […]

Carbon Footprint Calculator

This resource offers 3 different carbon footprint calculators. The individual calculator asks for car, transit, and home energy information based on your zip code. The calculator gives you the results instantly and then tells you what the trade off would be in terms of planting trees. For example, “Your carbon footprint is 5,784 lbs of […]